-
Summary • At a glance
Problem: Under regulatory scrutiny, teams could not reliably discover or defend the trustworthiness of enterprise data across a fragmented landscape.
What I did: Designed and delivered a service-oriented platform for data discovery, onboarding, governance visibility, and lineage.
Impact: Replaced ad-hoc, manual workflows with an auditable, scalable service model embedded into CIB’s governance roadmap.
As part of the CIB Operations programme, collaborated with the Operations team as an independent contributor to design and deliver an internal data service platform supporting enterprise discovery and governance.
The platform was intended to provide a structured, consistent source of risk data across front-to-back office functions, enabling self-service access, improving transparency of ownership and lineage, and reducing reliance on manual workflows under increasing regulatory pressure.
— The Challenge
When trust in data is questioned, everything slows down
In the middle of a regulatory review, a risk manager is asked a simple question: Where did this number come from?
Answering it should take seconds. Instead, it triggers a chain of emails, spreadsheets, and calls across teams and systems. Ownership is unclear. Lineage is partial. Confidence drops — not because the data is wrong, but because nobody can prove that it’s right.
This wasn’t an exception. It was routine.
By 2020, Deutsche Bank’s Corporate & Investment Bank operated across more than 7,000 applications, many of them legacy or siloed. Data producers and consumers had no consistent way to discover, validate, or trust the data underpinning decisions.
The problem wasn’t a lack of data.
It was decision-making with incomplete visibility, under scrutiny.
“On a daily basis I have to use and source data from many systems. Too many things have to be done manually.” — Risk Manager, Risk Wide

— What success had to look like
If trust was the issue, the solution couldn’t just be another catalogue or dashboard. It had to change how people made decisions.
- Make trust visible, not assumed.
Users needed to see ownership, maturity, and lineage without deep technical investigation or personal mediation. - Enable discovery without dependency.
Finding the right data could not rely on knowing the right person, team, or inbox. - Embed governance into daily work.
Governance had to be continuous and observable — not something surfaced only during audits.
Success wasn’t measured by feature delivery.
It was measured by whether teams could answer questions with confidence — and move on.
— Approach adopted
Designing for people, not just frameworks
- Co-designed with publishers and consumers through workshops and walkthroughs to uncover hidden manual work, ownership gaps, and failure points.
- Iterated in the open via short delivery cycles and frequent stakeholder demos to keep alignment tight and reduce late rework.
- Designed for adoption, not just correctness by making governance and trust signals visible in the places users actually work.
— Solution overview
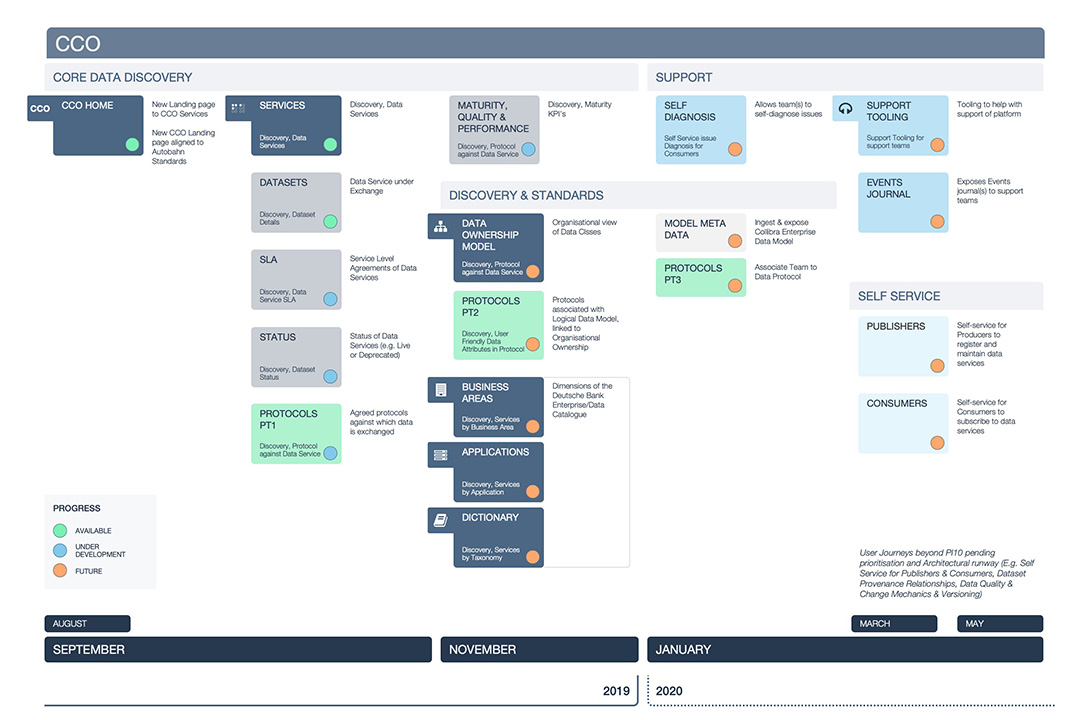
Five epics. One platform. Zero guesswork.
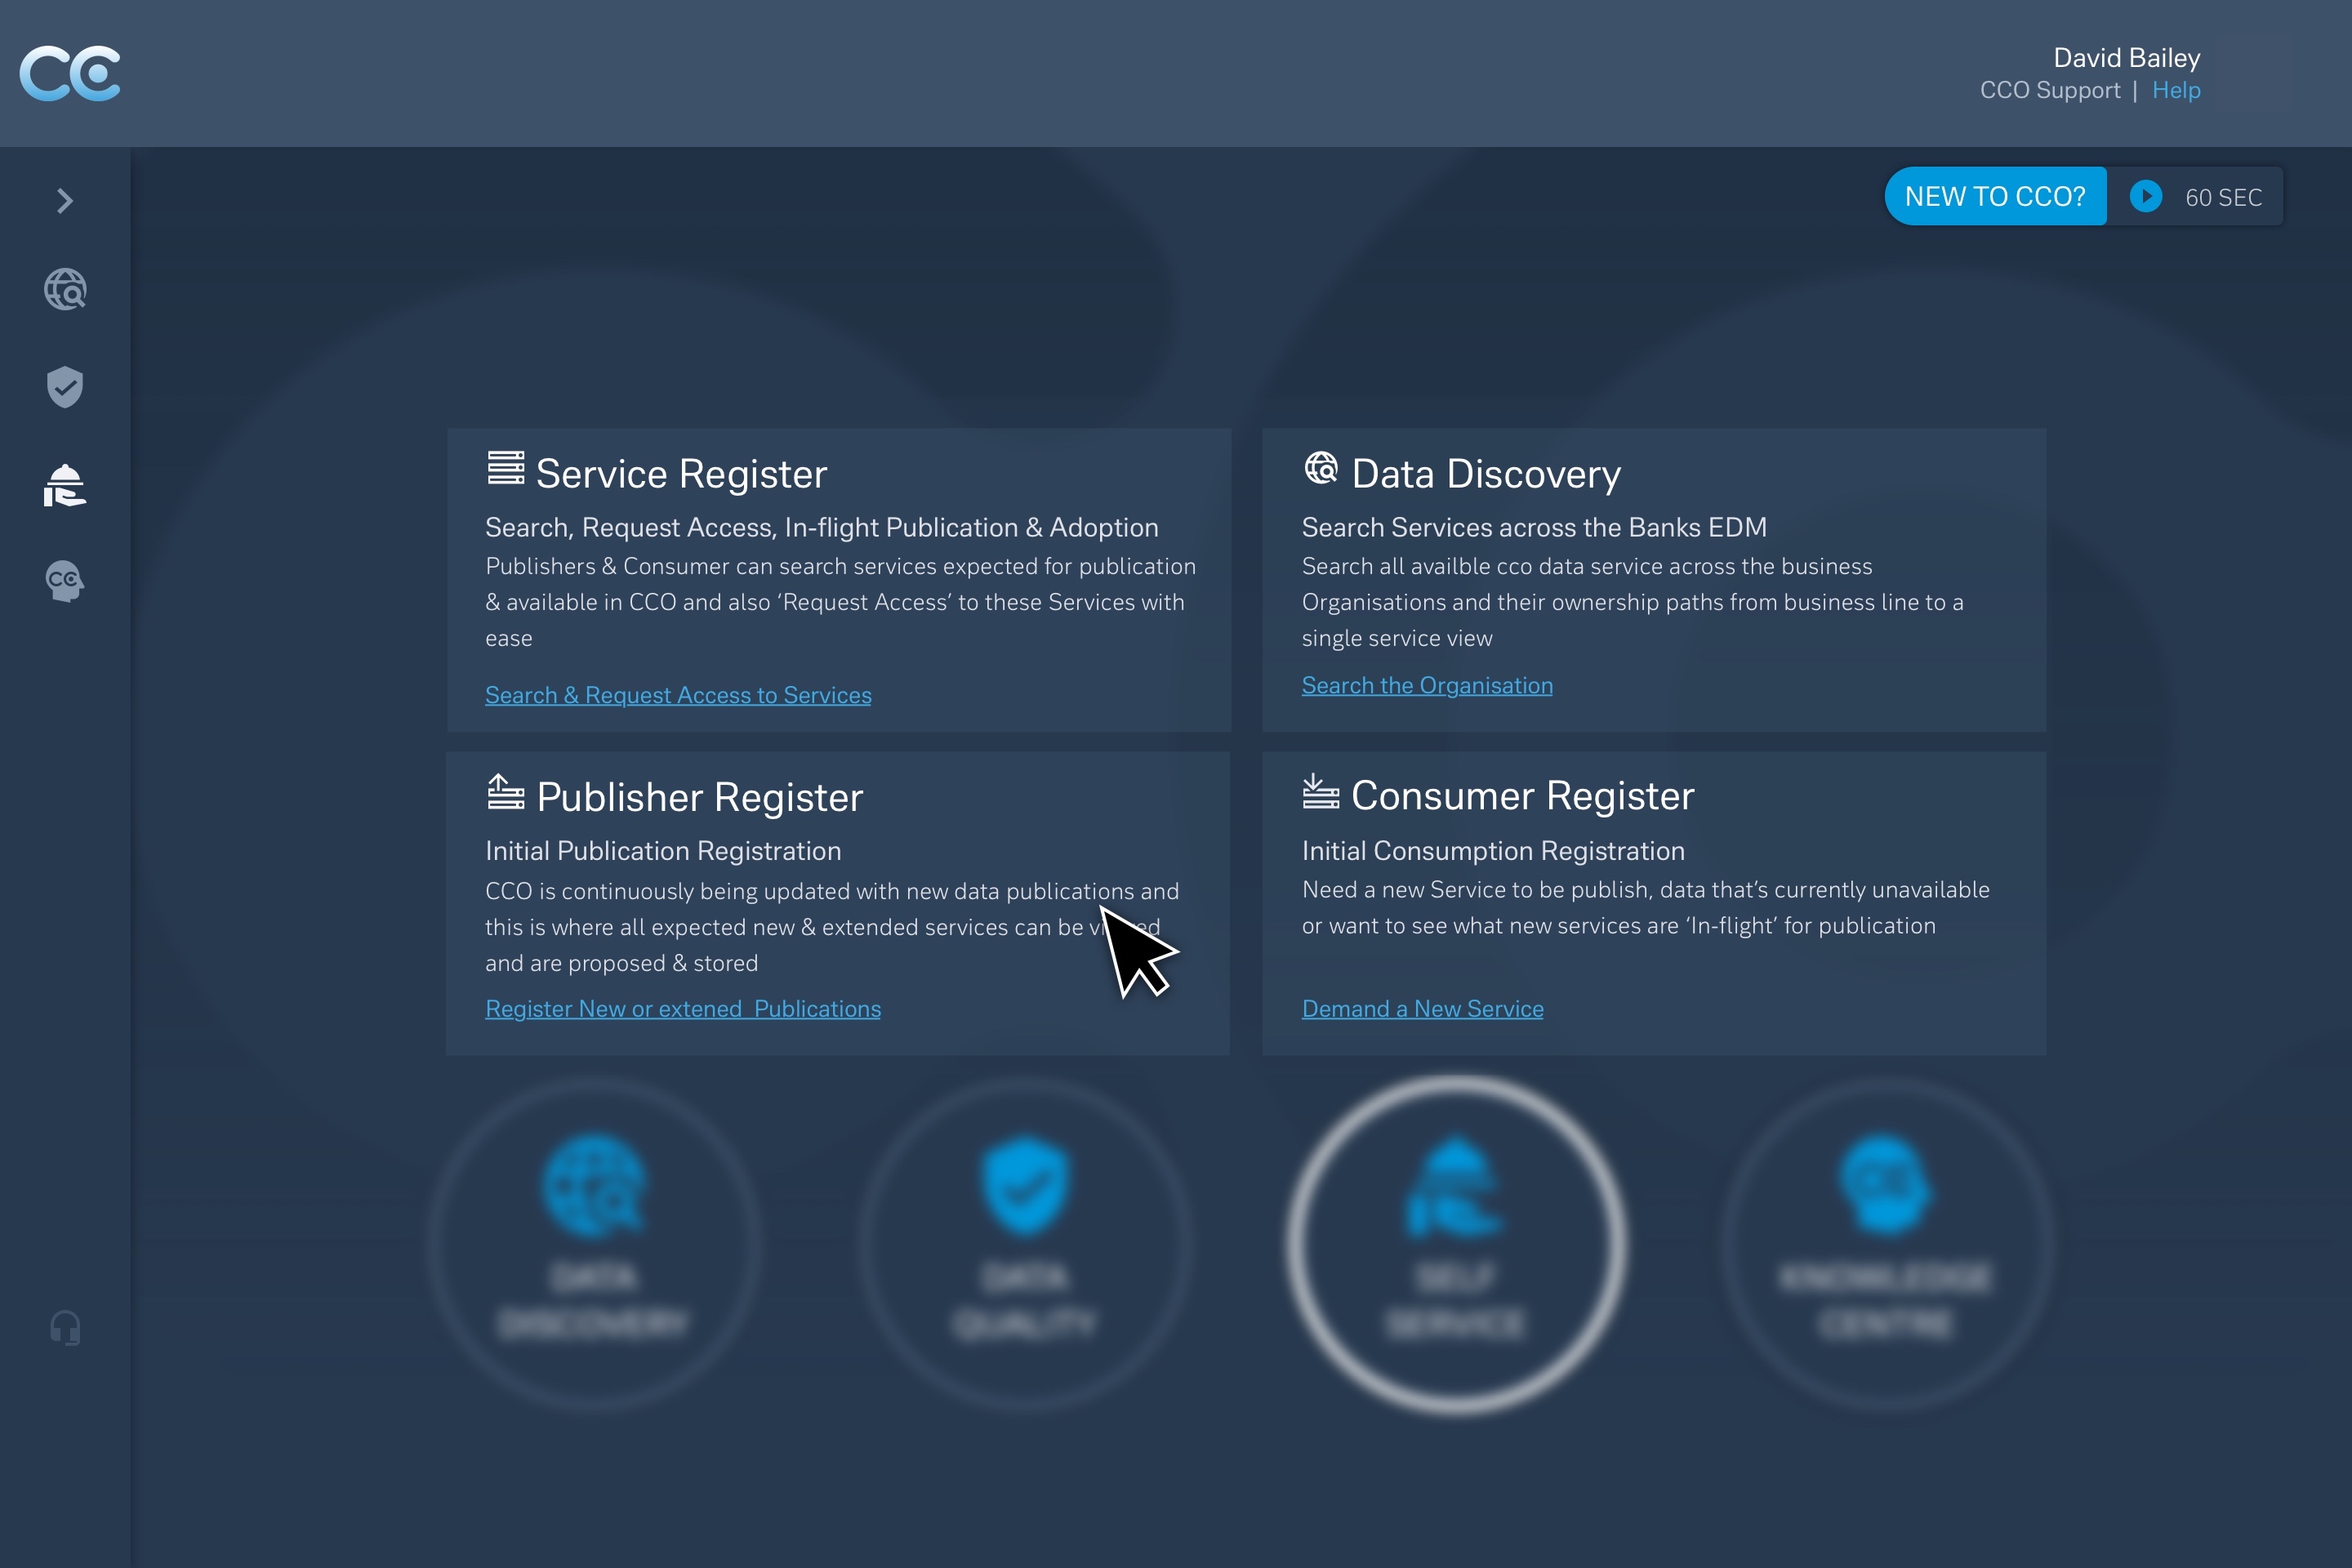
Rather than building a single monolithic tool, the platform was structured around five service-led capabilities, each solving a distinct trust problem.
1) CCO as a Data Service
A service-based model defining ownership, SLAs, maturity, and lineage — shifting data from an abstract asset to something that can be evaluated and relied upon.
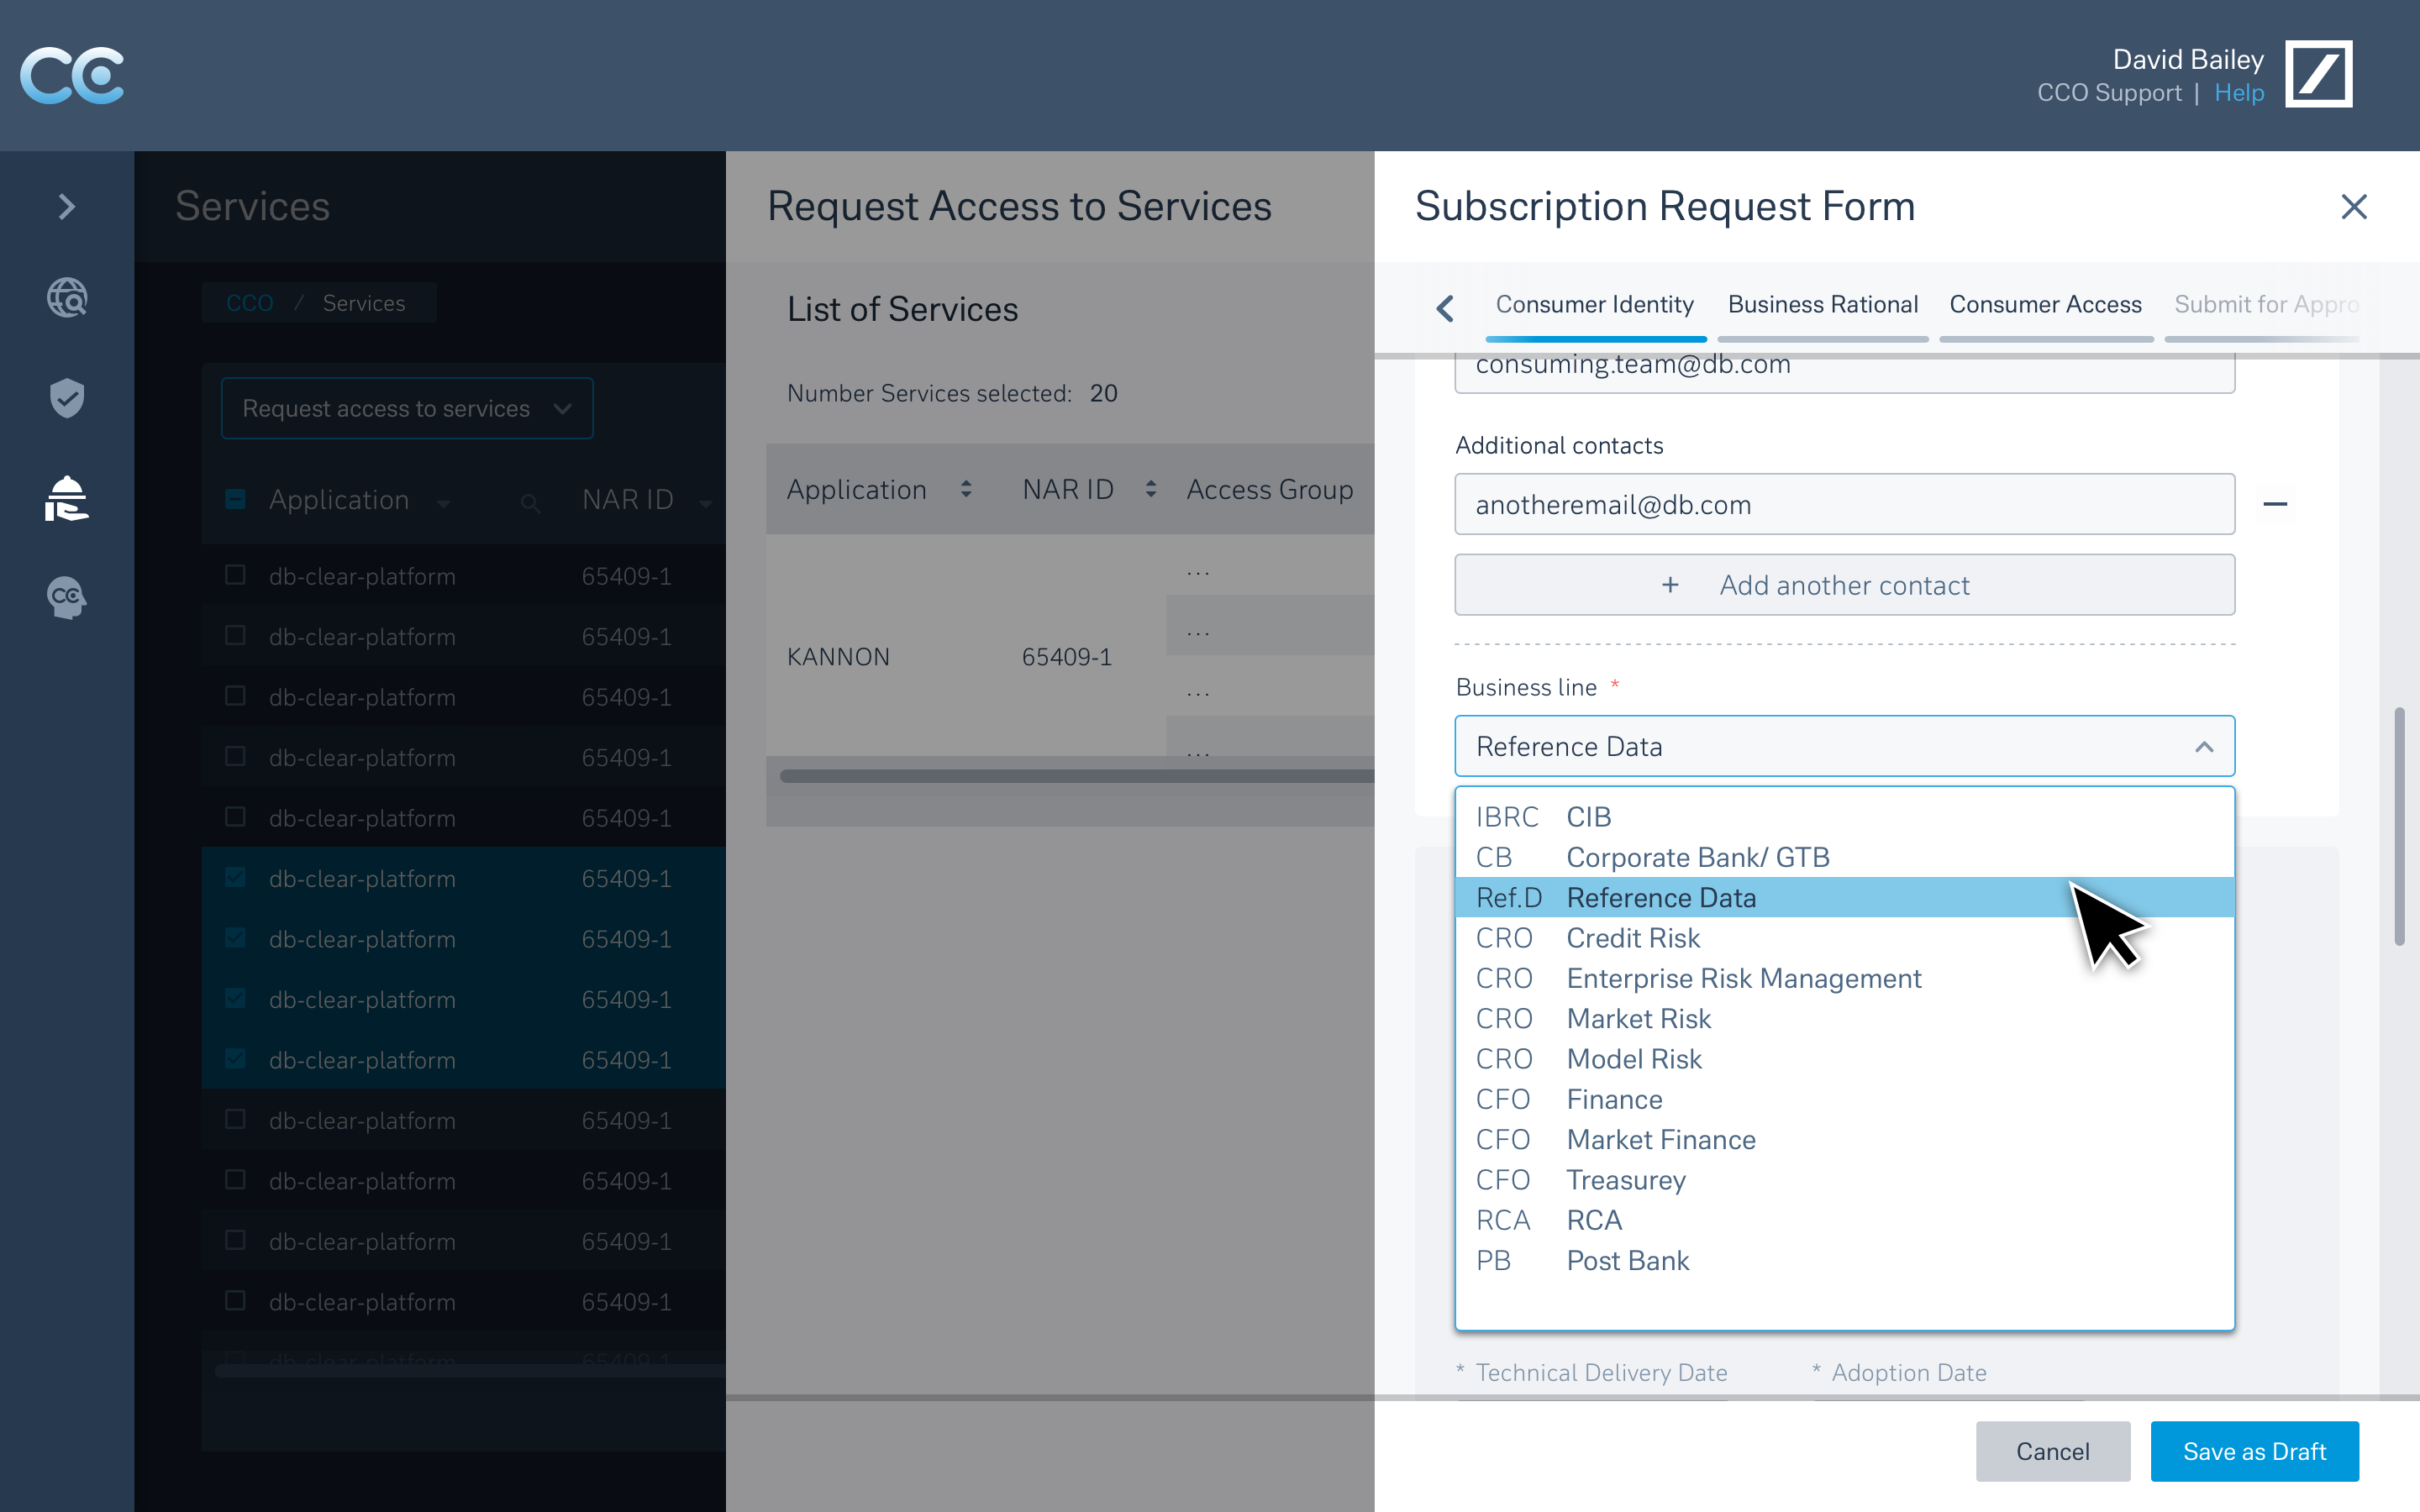
2) Self-Service Onboarding
Guided flows for new data sources and consumers, replacing spreadsheet-driven coordination and long email chains.
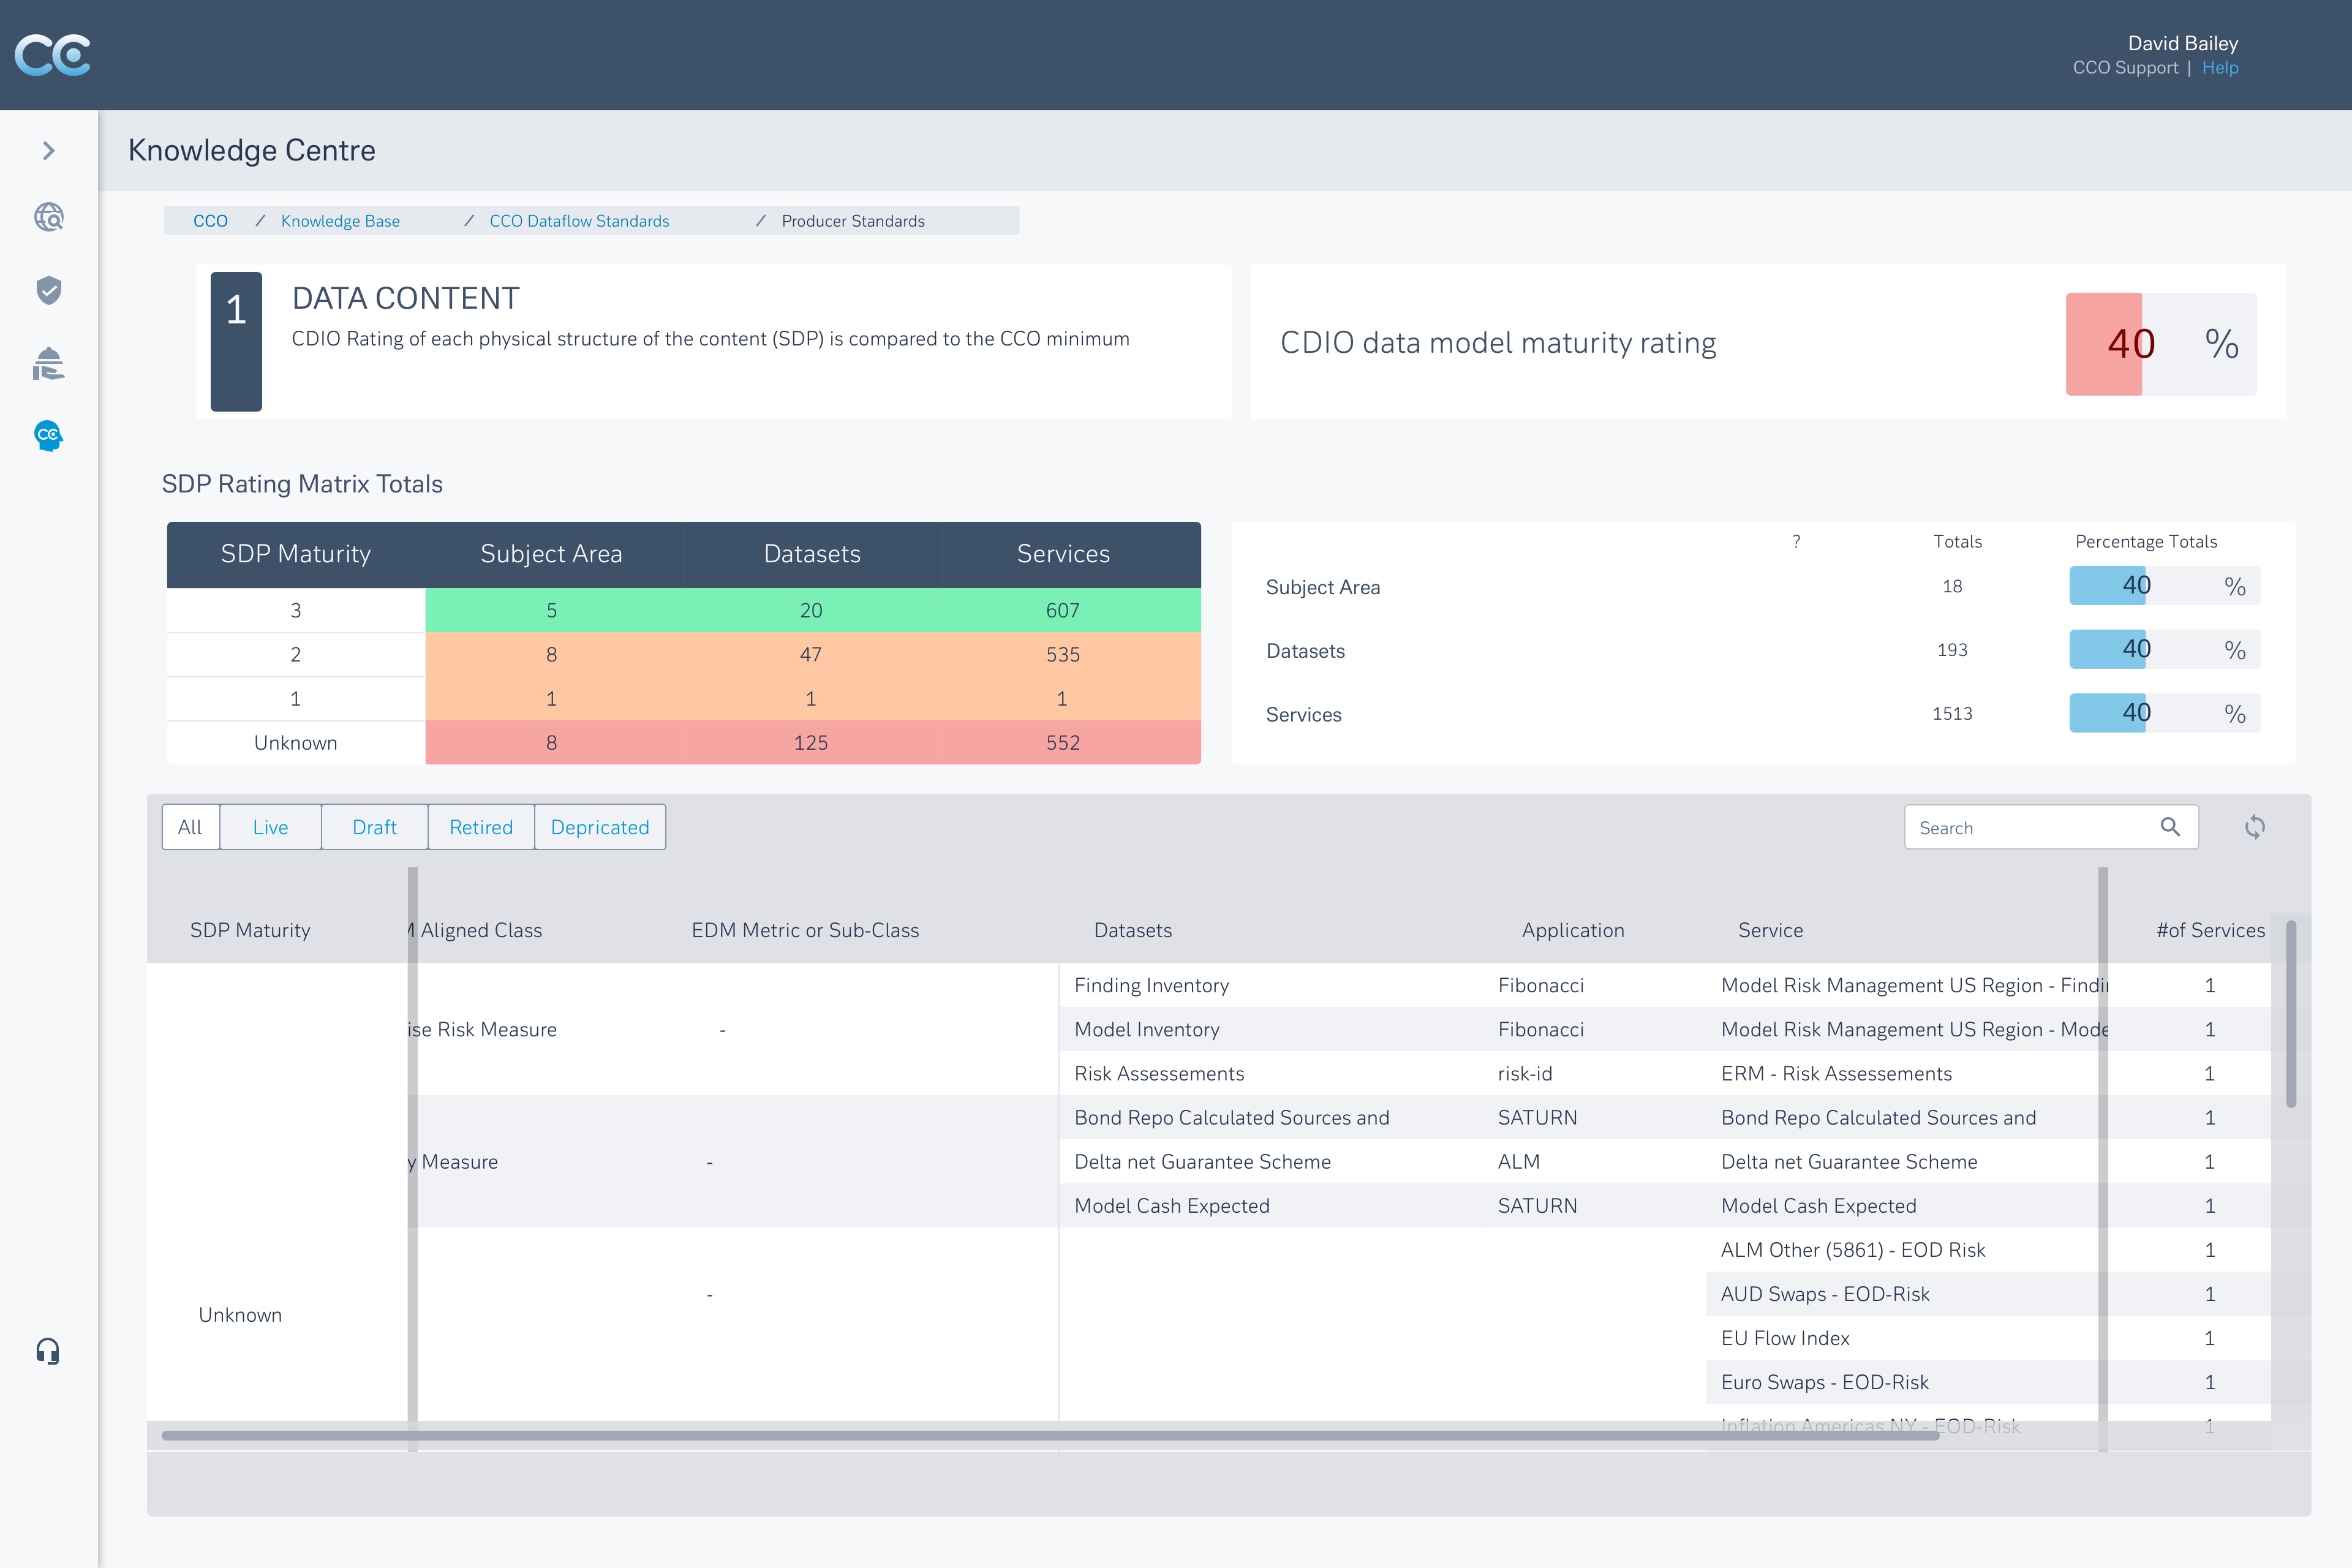
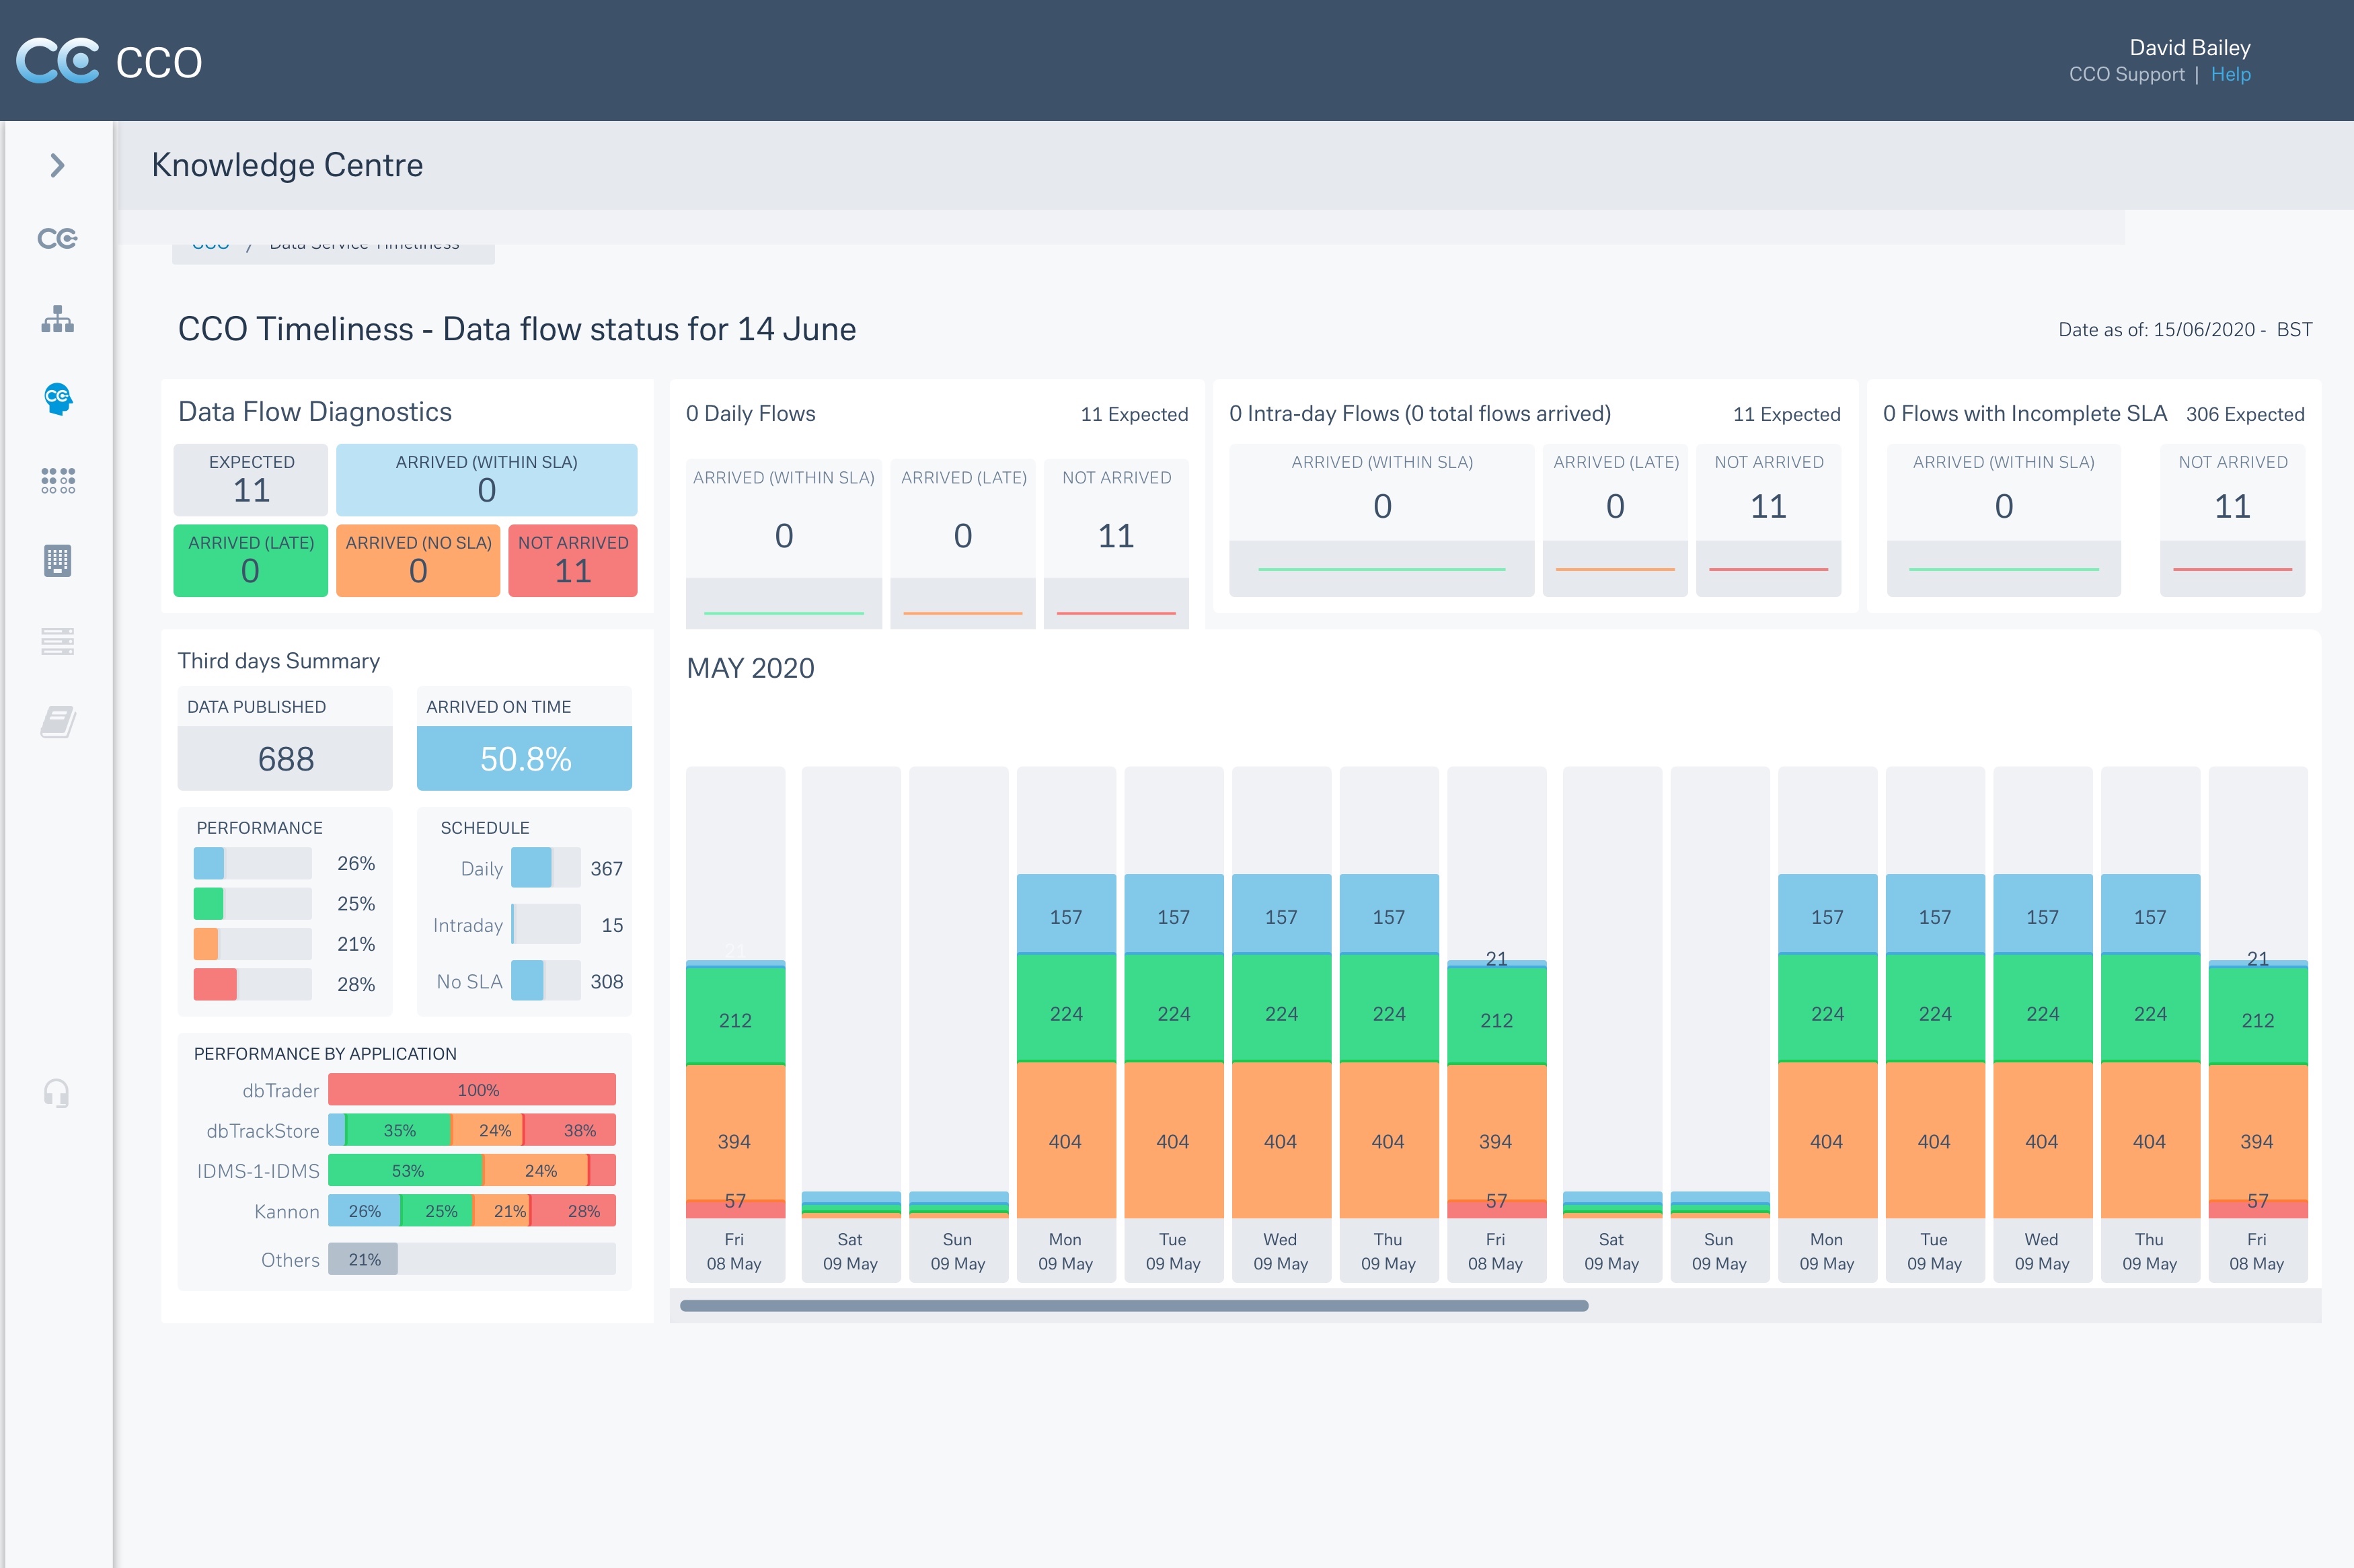
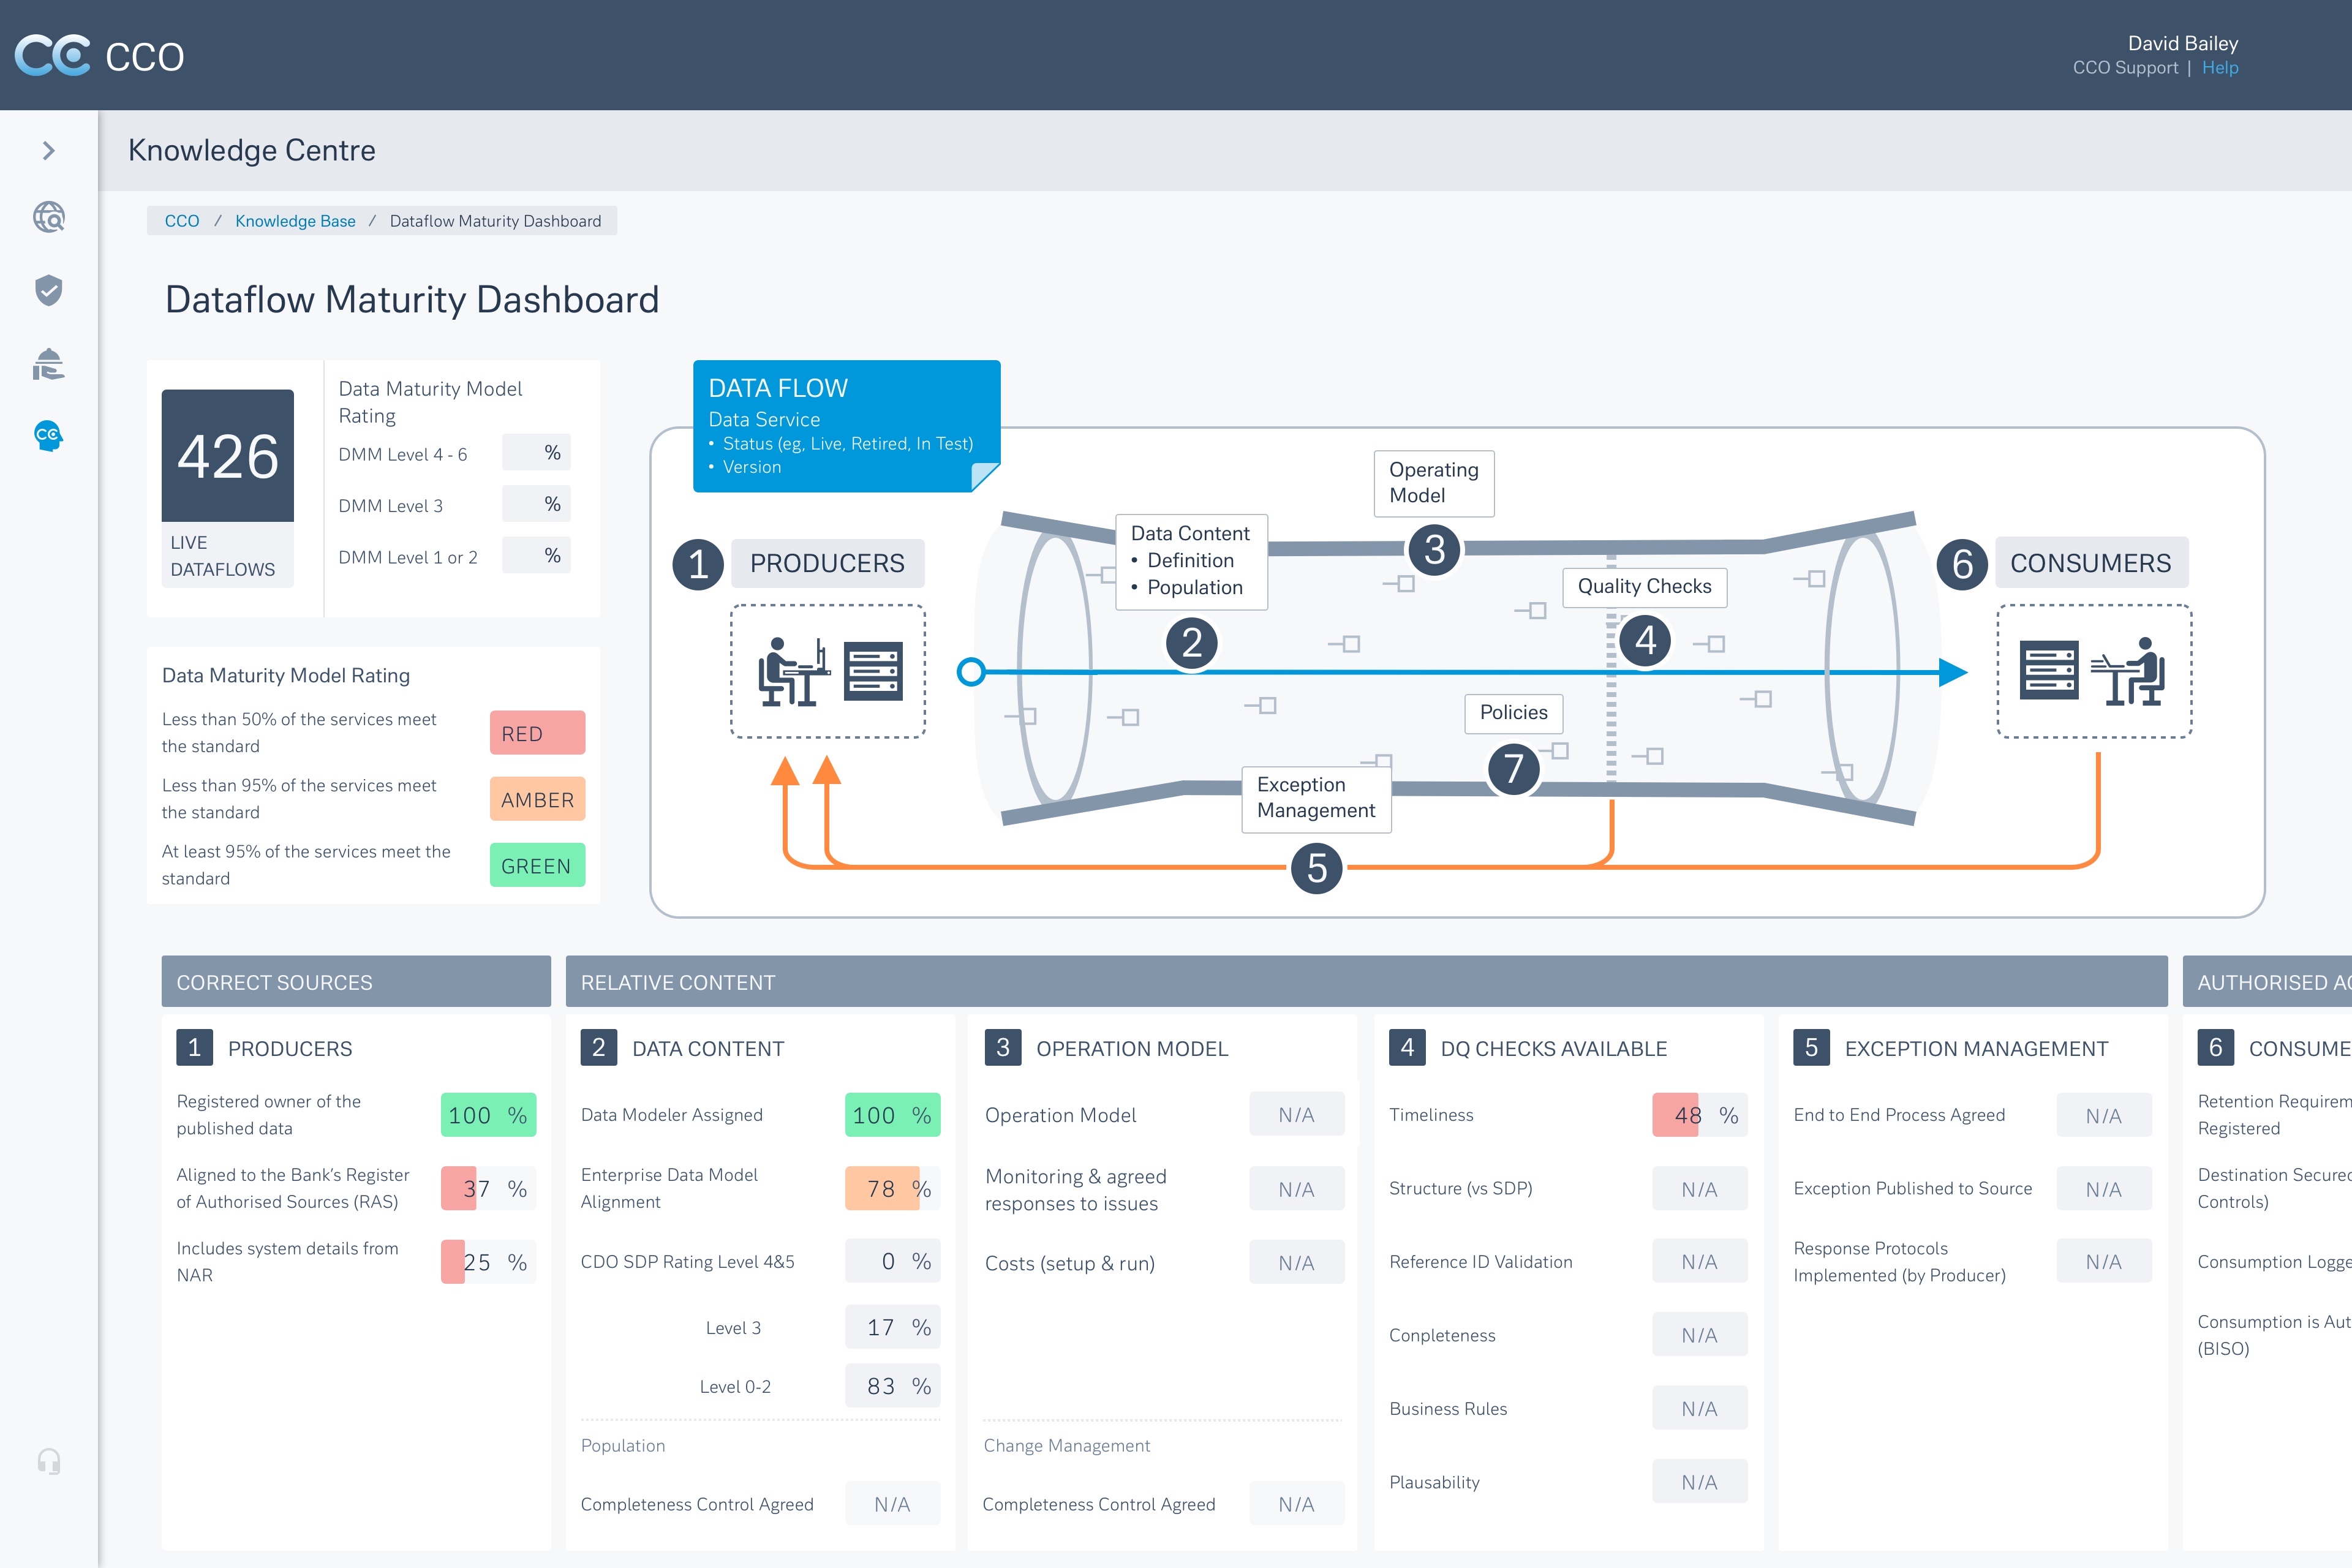
3) SLA Transparency and Governance
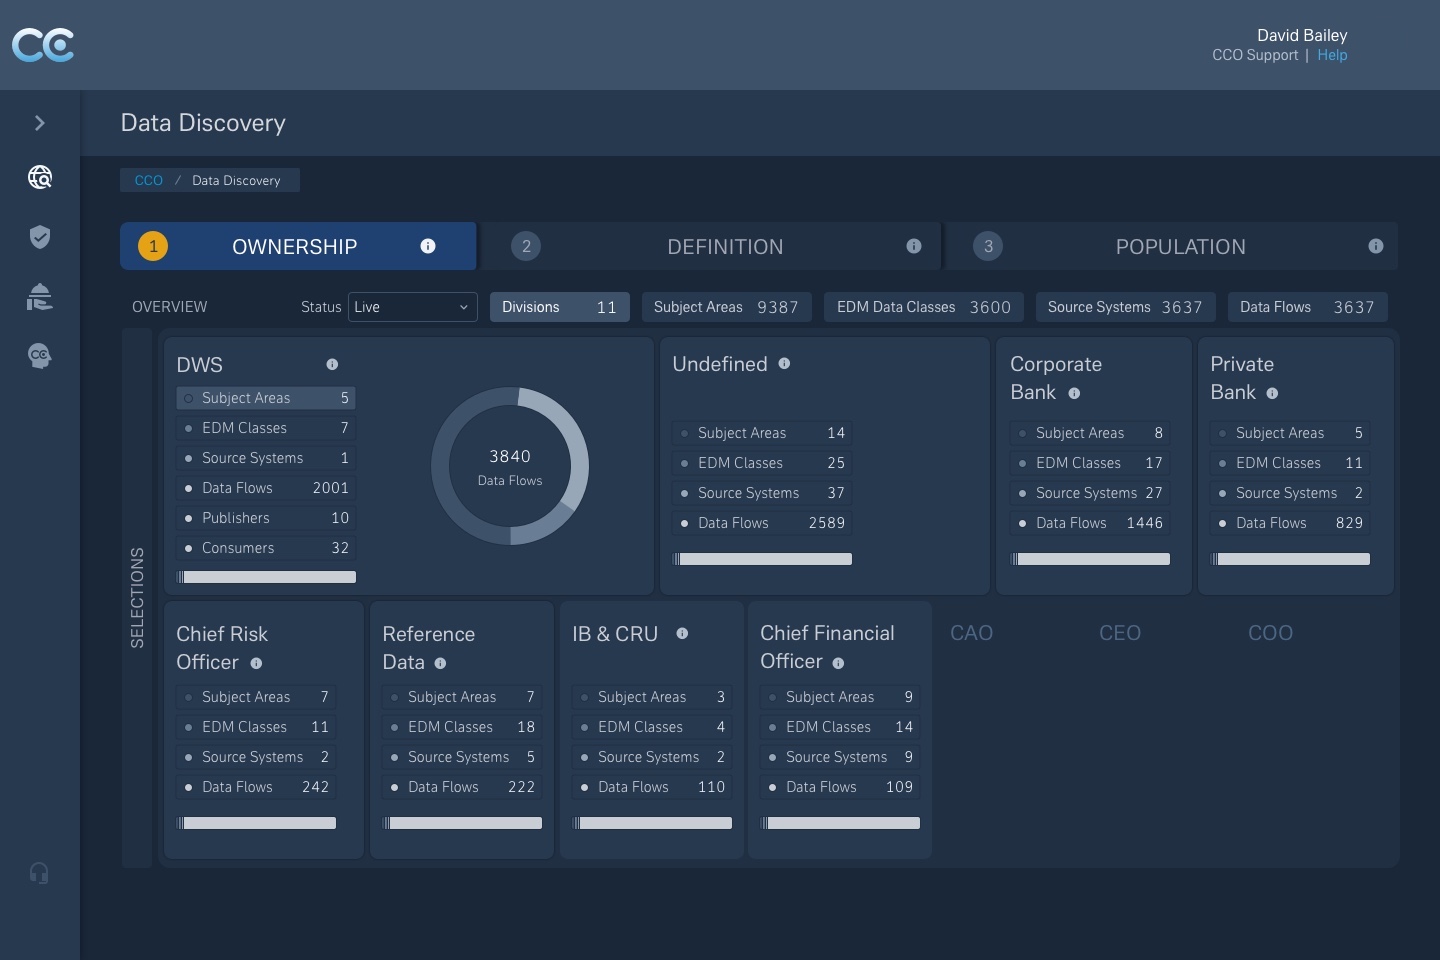
Live views of service maturity, SLA health, exception volumes, and ownership signals — making governance visible by default.
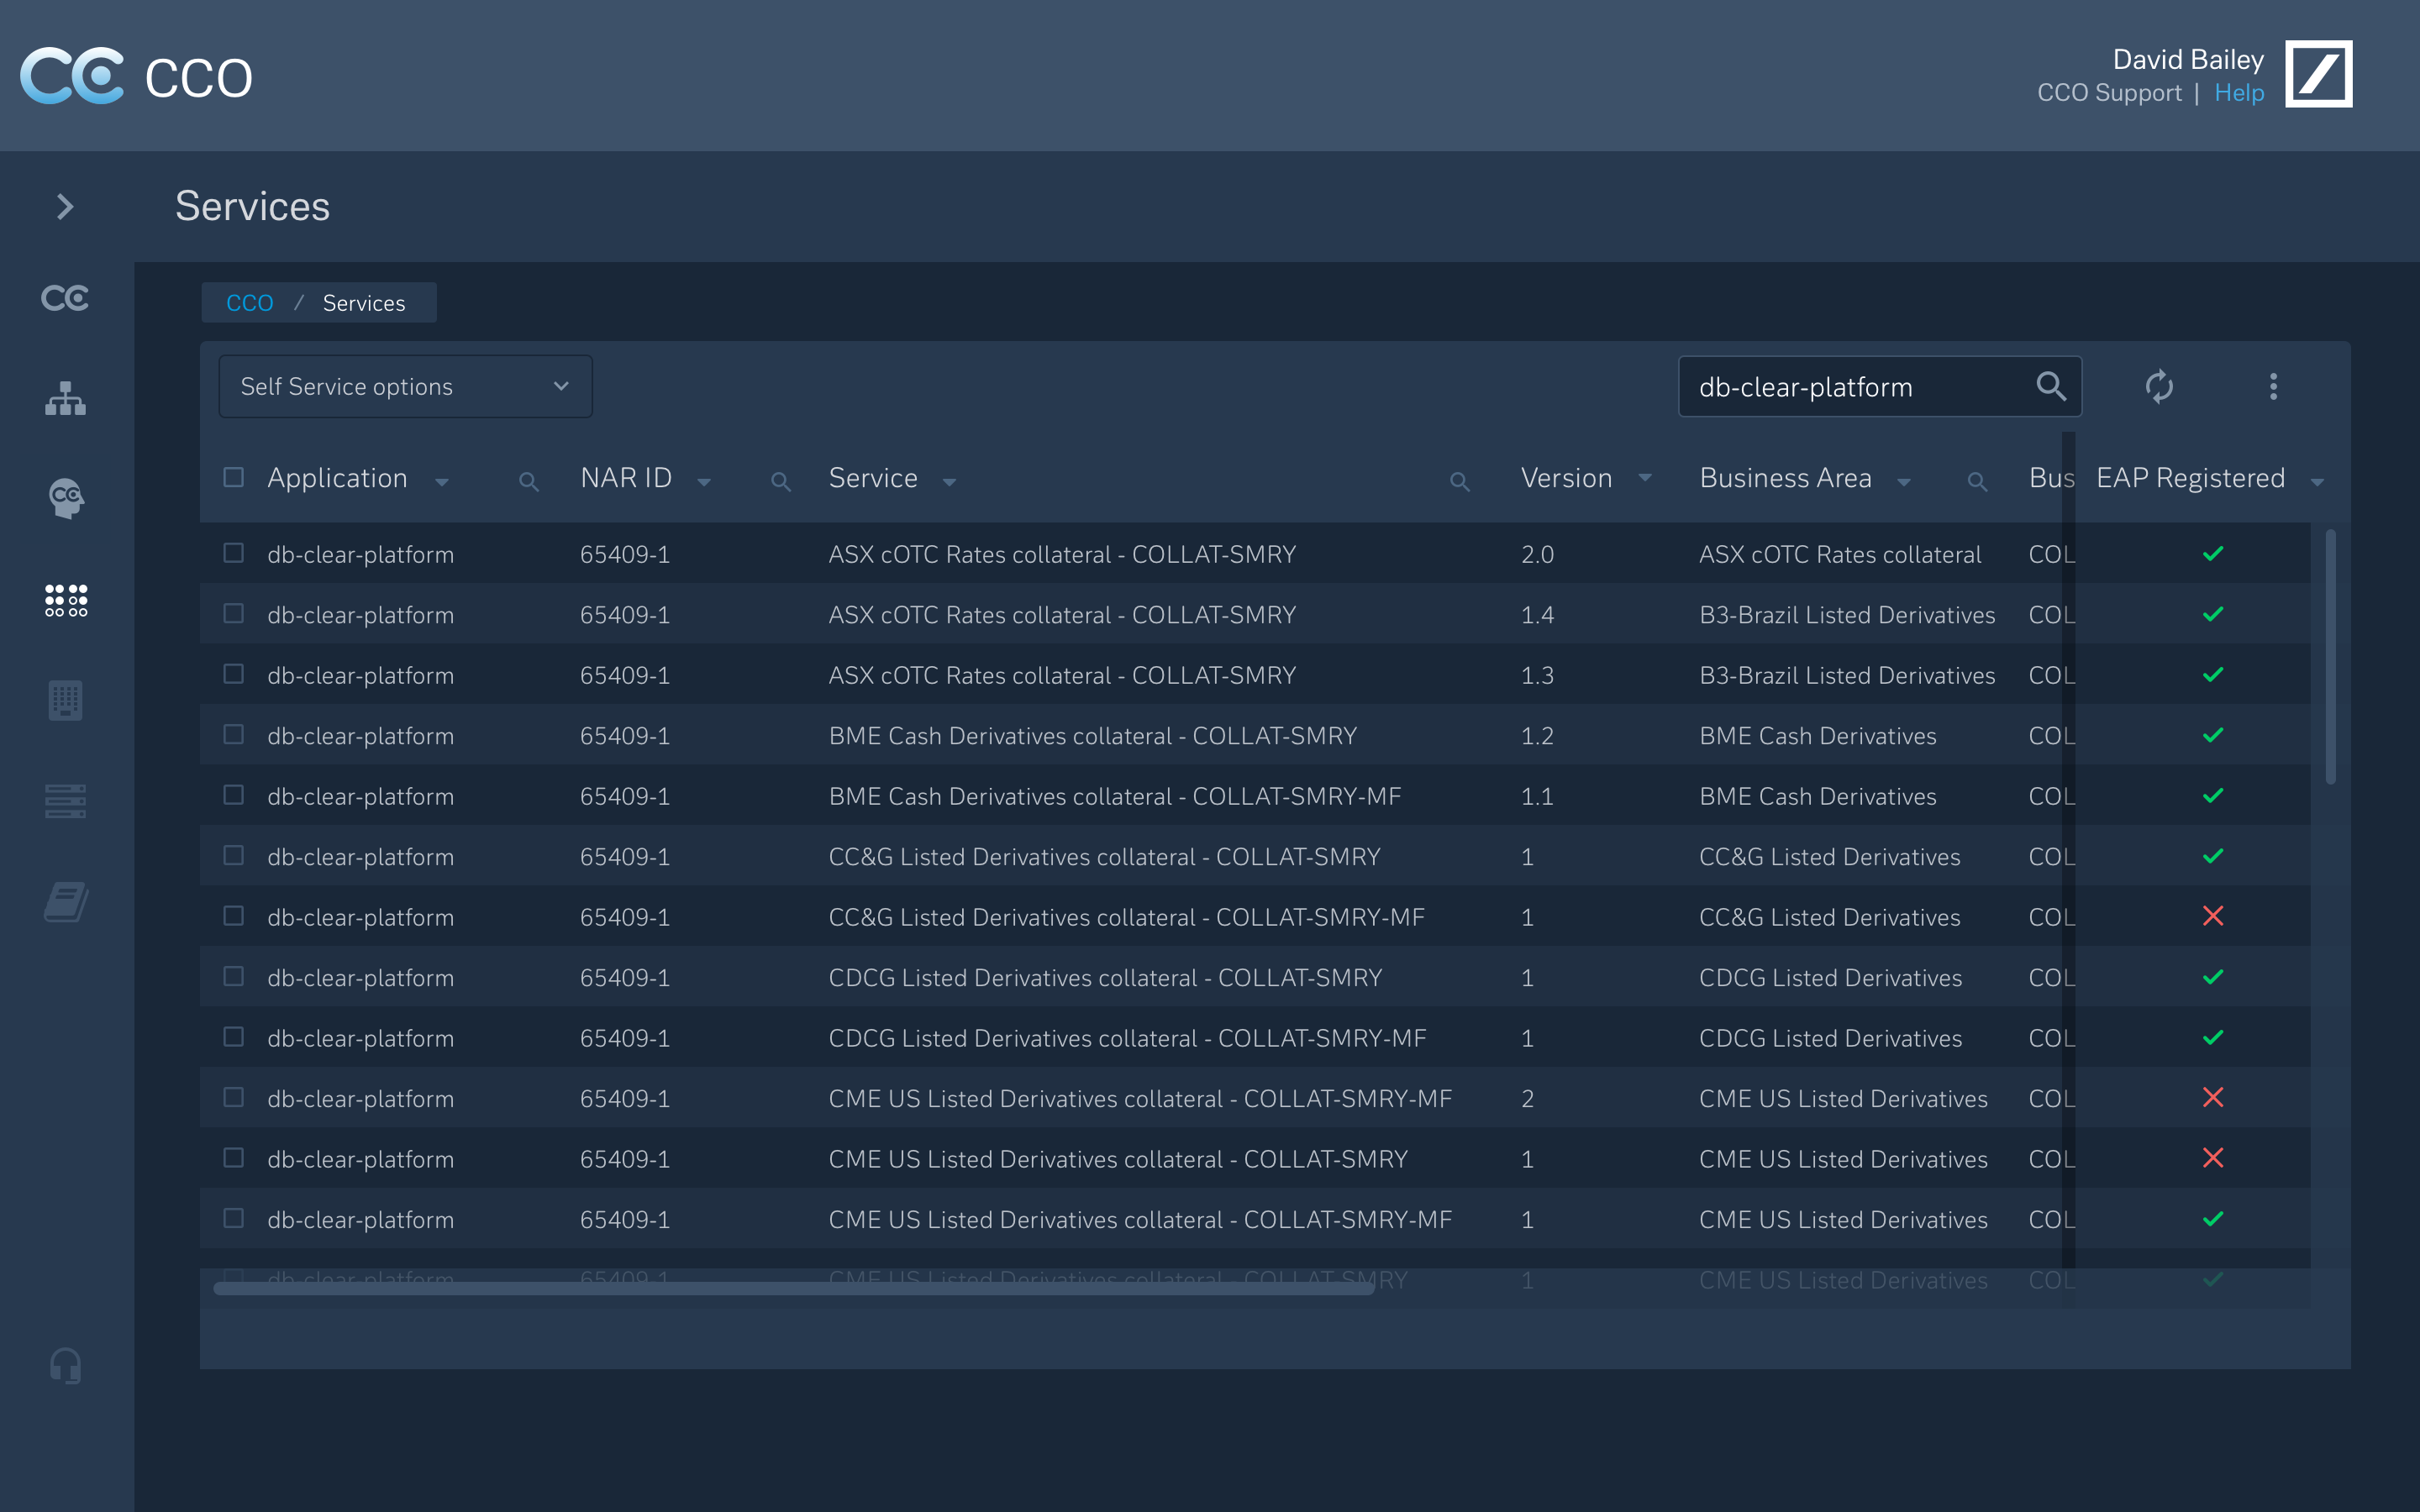
4) Search & Discovery
Entry-agnostic discovery allowing users to explore by domain, product, or attribute — surfacing adjacent services and lineage to provide context.
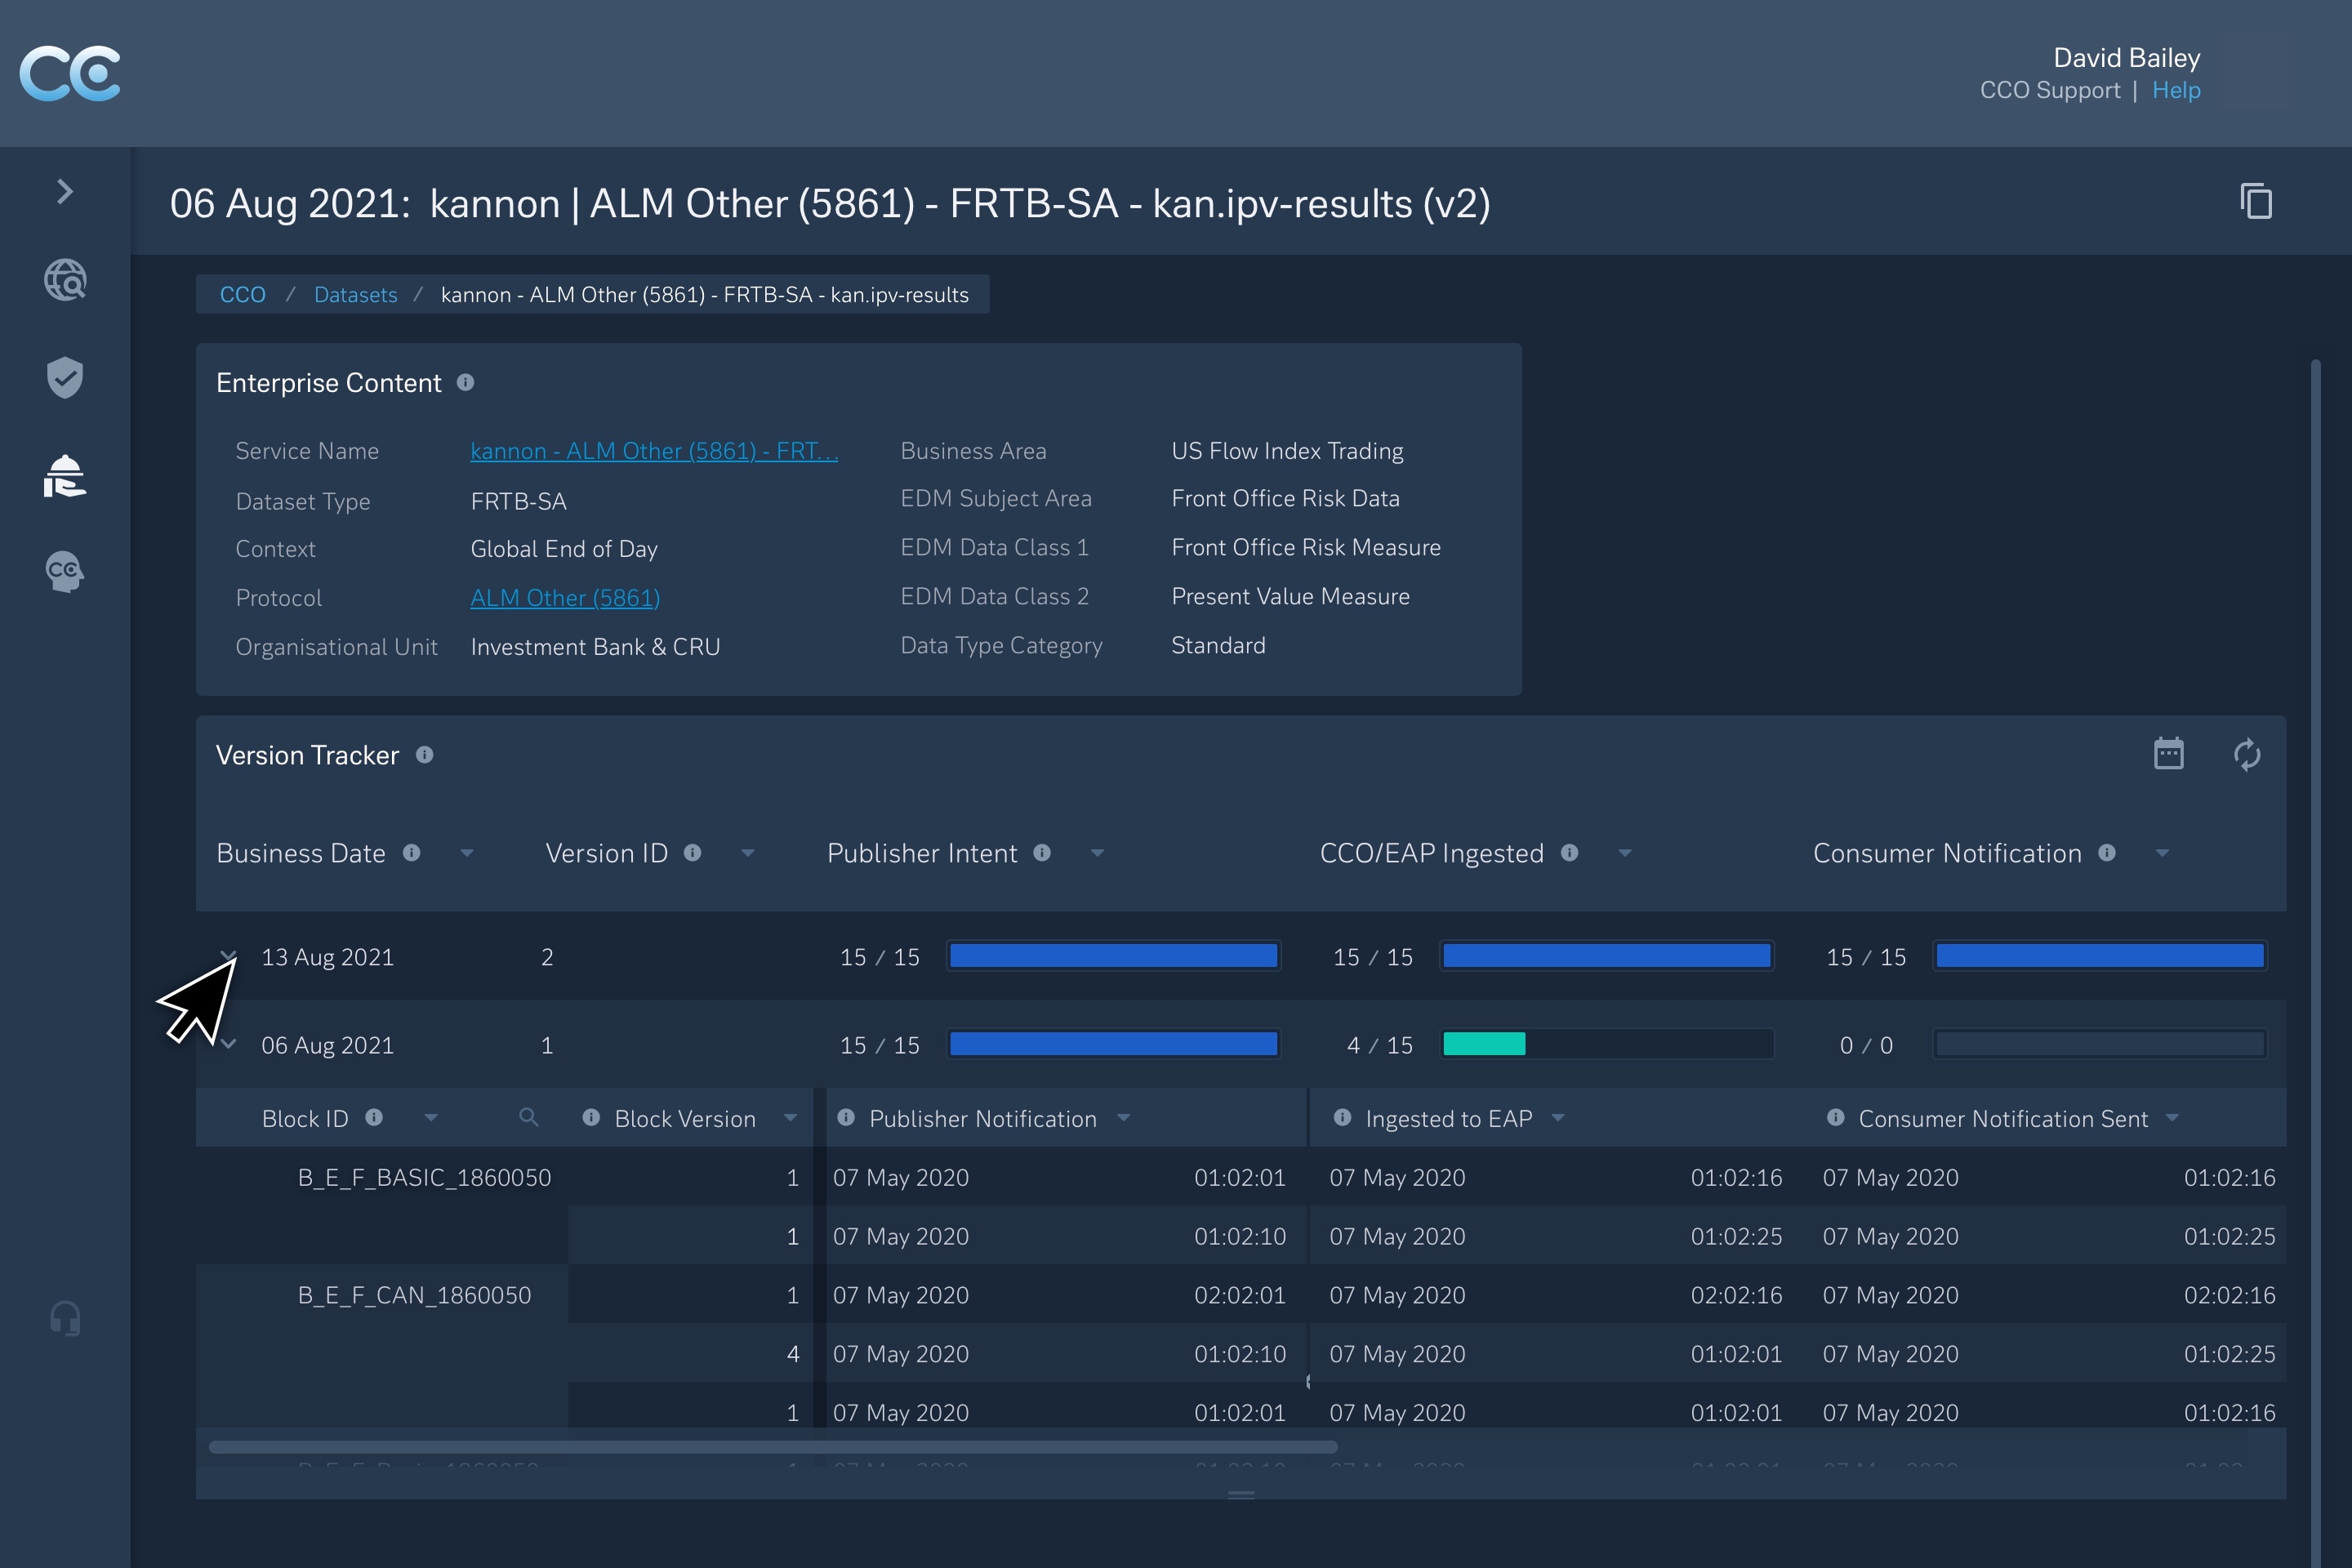
5) Data Model & Lineage Visualisation
Interactive representations of complex ownership structures and relationships between data services, controls, and entities — supporting traceability and audit readiness.
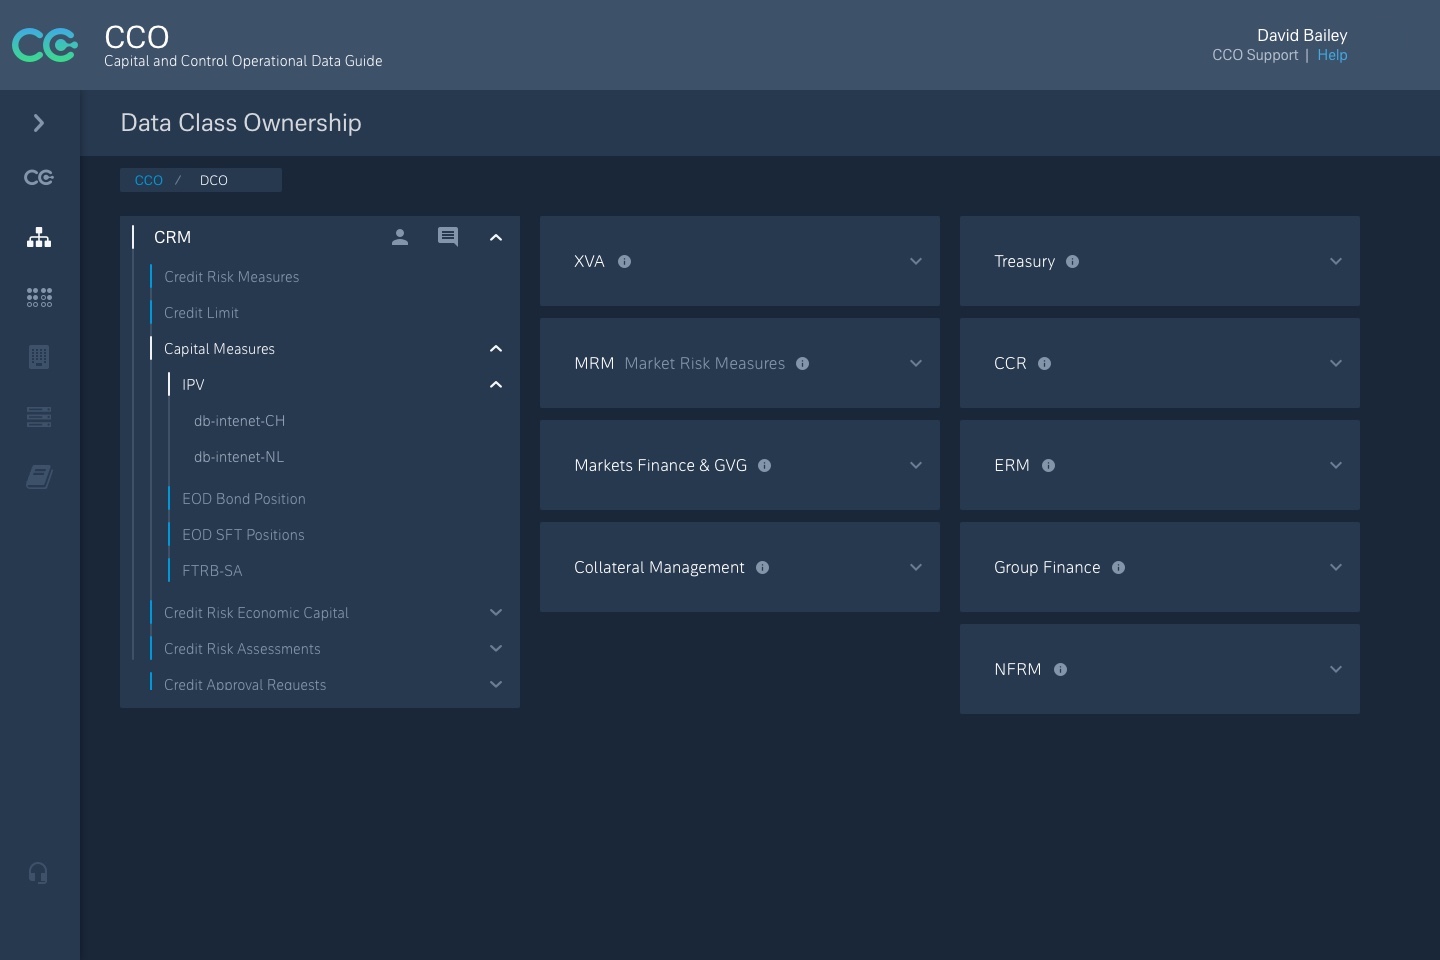
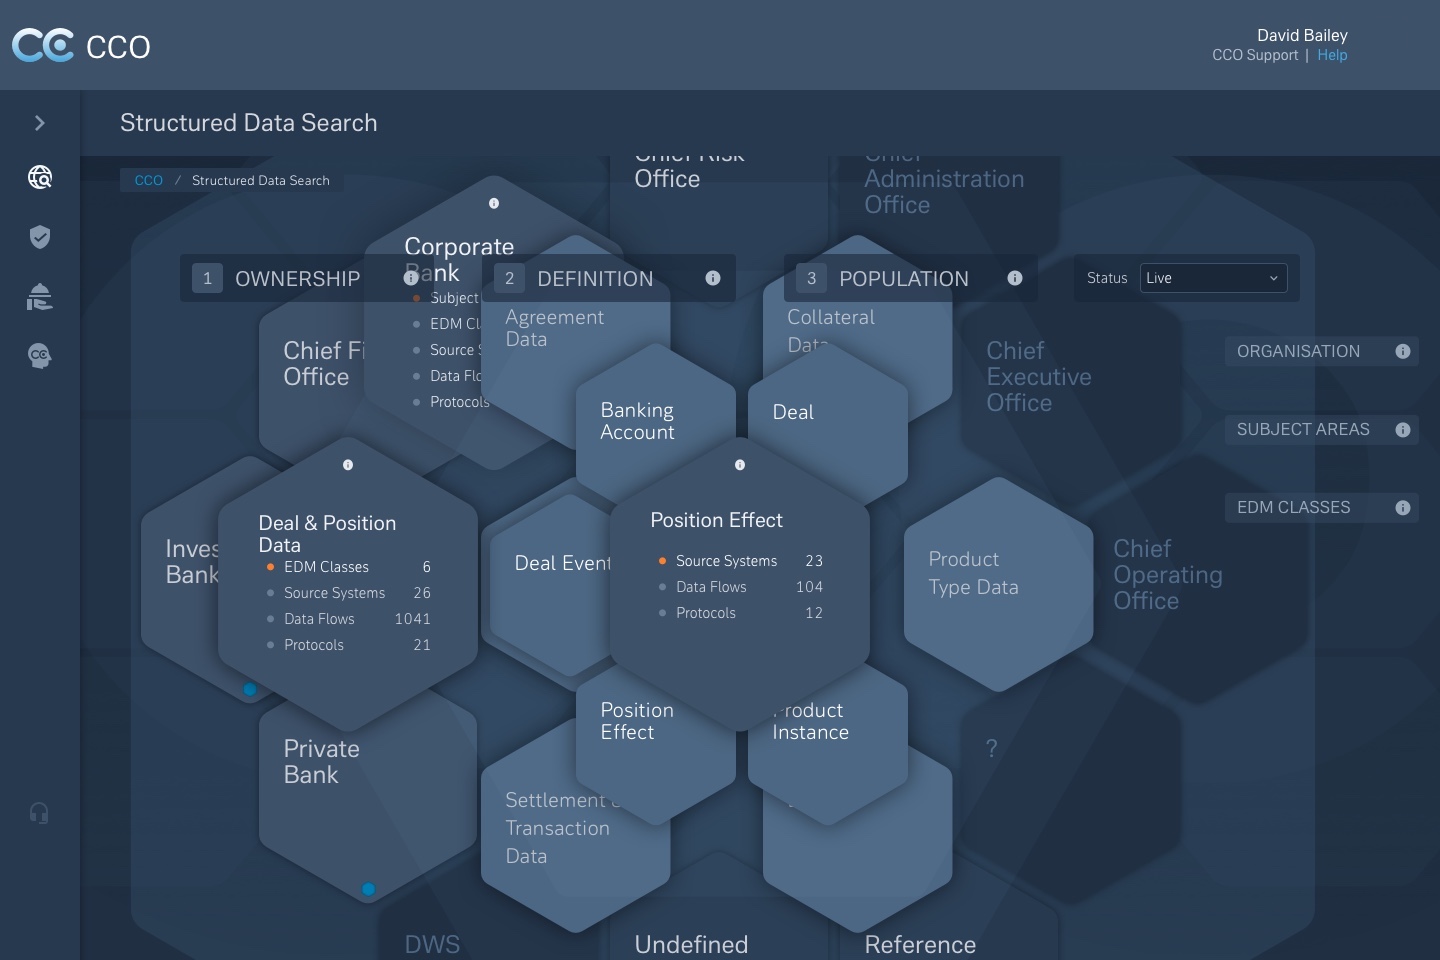
Concepts created to visualise the enterprise data model as an interactive, structured search.
- • Explored multiple layout models (grid, mosaic, tree) to represent complex ownership without losing readability
- • Prototypes tested how users navigate from product to service to data field
- • Prioritised traceability and transparency so trust could be assessed quickly
Together, these components formed a service experience that was auditable, accessible, and usable — whether the user was onboarding APIs or validating regulatory submissions.
— Design decisions
Navigating density, scale, and trust
Why hierarchical models didn’t scale
Early concepts used tree-style hierarchies to represent ownership and relationships. They worked — until they didn’t.
As service volume increased, hierarchy views became dense and unreadable. Users spent more time navigating structure than understanding meaning. I moved away from strict hierarchy towards layered, mosaic-style models with progressive disclosure.
Trade-off: reduced immediate hierarchy in exchange for clarity and scalability.
Why governance had to be visible at a glance
In many tools, governance exists, but it’s buried. Users have to dig to answer a basic question: Can I trust this data?
I deliberately surfaced service maturity, SLA status, and issue volume as primary signals so trust could be assessed quickly without deep technical inspection.
Trade-off: less space for raw metadata in favour of faster, safer decision-making.
Why discovery had to be search-first
Users searched differently: some by domain, others by protocol or product. I designed discovery to be entry-agnostic, with search as the primary entry point and lineage surfaced contextually.
Trade-off: search-first systems need stronger contextual cues to avoid disorientation — which demanded more design effort up front.
Why fidelity and testing were staged deliberately
Designs were tested at low, medium, and high fidelity throughout sprints. This wasn’t about polish. It was about clarity under cognitive load, accessibility for non-specialists, and tolerance for imperfect or incomplete data.
— Metrics & outcomes
Consequences of decisions
This programme wasn’t designed to optimise individual task timings. It was designed to change how trust and governance operated day to day. The outcomes reflect that shift.
Delivery summary
- • 19 months of continuous delivery
- • 8 epics delivered
- • 70+ stories implemented
- • Bi-weekly demos across squads and leadership
| Area | Before | After |
|---|---|---|
| Data discovery | Relied on personal networks and shared drives | Federated searchable catalogue with lineage |
| Governance visibility | Periodic audits | Live dashboards with maturity and SLA visibility |
| Exception management | Email chains | Structured escalation and resolution flows |
| Service communication | Tribal knowledge | Defined roles and service communication paths |
— Strategic outcomes
Embedding trust, not just tools
The platform now acts as a governance scaffold across the CIB division, aligned with Deutsche Bank’s cloud and data infrastructure roadmap.
It established a baseline for
- • Ongoing regulatory alignment (BCBS 239, FRTB)
- • Federated domain ownership models
- • Auditable workflows across internal and third-party data
Most importantly, it changed how people interact with data and with each other — shifting governance from a periodic exercise to a continuous practice.
“CCO is now something that can be used, governed, and built on.” — Senior UX Architect, CCO Delivery